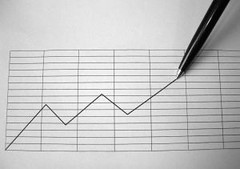
Design a chart with the following data:
1. STUDENT'S NAME
2. DATE
3. KIND OF HERB SEED- PLANTED
4. MEASUREMENTS OF PLANT'S GROWTH
At the end of three weeks convert this data into a graph. You might also discuss which herbs grew faster and why.
 A place for teachers, parents and
other educators: offering a
variety of articles and helpful
tips on teaching and parenting.
A place for teachers, parents and
other educators: offering a
variety of articles and helpful
tips on teaching and parenting.
No comments:
Post a Comment